

The new 2018 state-by-state craft brewer statistics have been published on the website. I wanted to briefly outline what these numbers reflect and highlight a few trends I saw as I was compiling the data.
The Numbers
Let’s start with what the numbers represent.
They reflect the number of craft breweries by state and their production in those states. These aren’t sales figures, and while production and sales are certainly correlated, they don’t always move in the same direction year-over-year. To compile these, we take the raw brewery-by-brewery production numbers we get in our annual production survey, add them up by state, and then make a bunch of adjustments for brewers that produce in multiple states or contract in another state. To preserve brewery data privacy, we don’t release those adjustments, but that’s why you don’t get the same numbers if you add up the brewery production by the state headquarters in our members only brewery production data (which will be updated in early to mid May this year).
Because breweries do sometimes move production across state lines or build new facilities, some of the changes in state-by-state production aren’t “real” in the sense that they don’t always reflect changes in the health of brewers in that state. With the rise of more craft brewery groups, we often see production shift from one state to another as brewery groups use other facilities in that group rather than wherever they were contracting or running an alternating proprietorship previously. How do we know these changes are occurring? Breweries tell us and often report their facilities separately, but you can also look at Tax and Trade Bureau Certificate of Label Approvals (COLAs) as a way of seeing these shifts in production. However, even if they aren’t a perfect snapshot of state performance, these state numbers provide insights into the variations in growth we’re seeing around the country.
The Breweries
Now, let’s talk about the number of breweries.
As I’ve written about previously, at a state-by-state level, the absolute number of brewery openings continues to be driven primarily by population (correlation was .81 in 2018 looking at openings versus the 21+ population). Around half of the brewery openings in 2018 (more than 500 total) occurred in ten states, which collectively represent more than half the 21+ population in the U.S. California again saw the most brewery openings, and that’s before we get the final state production list and undoubtedly find more. Texas, Florida, and New York each saw more than 40 openings as well. The most surprising numbers at the top of the list for me were from Pennsylvania, Colorado, and Ohio, which saw 60, 58, and 50 brewery openings respectively. Those are three brewery-dense states that aren’t at the top of the list in population that are still seeing a lot of brewery growth. If the total U.S. looked like those three states, there would have been closer to 1,800 brewery openings last year.
Even more interesting data emerges when you look at the per capita rankings and growth. States that already have the most breweries per capita continue to add more breweries per capita than states with fewer. From a certain perspective, this makes a lot of sense. States with demographic and regulatory factors that are favorable to small brewers should see the most growth, as they have in the past. At the same time, in an era where craft is everywhere and brewers’ rights have generally improved across the country (with some notable exceptions), you’d think we’d eventually see catch-up as the leading states become more mature. The state with the most brewery openings per capita in 2018? Maine. States in the Southeast continue to see below average openings and growth in per capita terms. The states that were the top 10 in per capita in 2017 averaged 1.1 brewery openings per 100,000 21+ adults in 2018, while the states that were in the bottom 10 in 2017 averaged 0.2 openings per 100,000 21+ adults in 2018. So, rather than seeing the distribution of breweries levelling out across the country, the brewery-rich states are getting richer and the brewery-poor states, while growing, are struggling to catch up.
Note: I’ve seen a couple of analyses that look at growth percentages in brewery numbers. I think that these are misguided. States might look like they have fast growth in percentage terms simply due to the small number of breweries in those states. A state going from four breweries to six breweries has a high percentage growth rate, but nowhere near the growth in breweries of a state going from 350 to 400 breweries.
The Market
What does this all mean for the market? Let’s start by re-stating what we know from the overall growth trends.
Most growth accrued to smaller, newer brewers in their first few years. Regional brewers had a more mixed record. Putting those together and applying to geography, it creates somewhat contradictory signals given the opening numbers above. States with a higher density of breweries tended to see more openings and got growth from those openings, but also tended to have more regional craft brewers. But, if we remove the very top end of craft regionals, the picture becomes clearer. Pulling the top four craft brewers in 2018 out of the numbers, we see that there is a .8 correlation between brewery openings and the growth in state production.
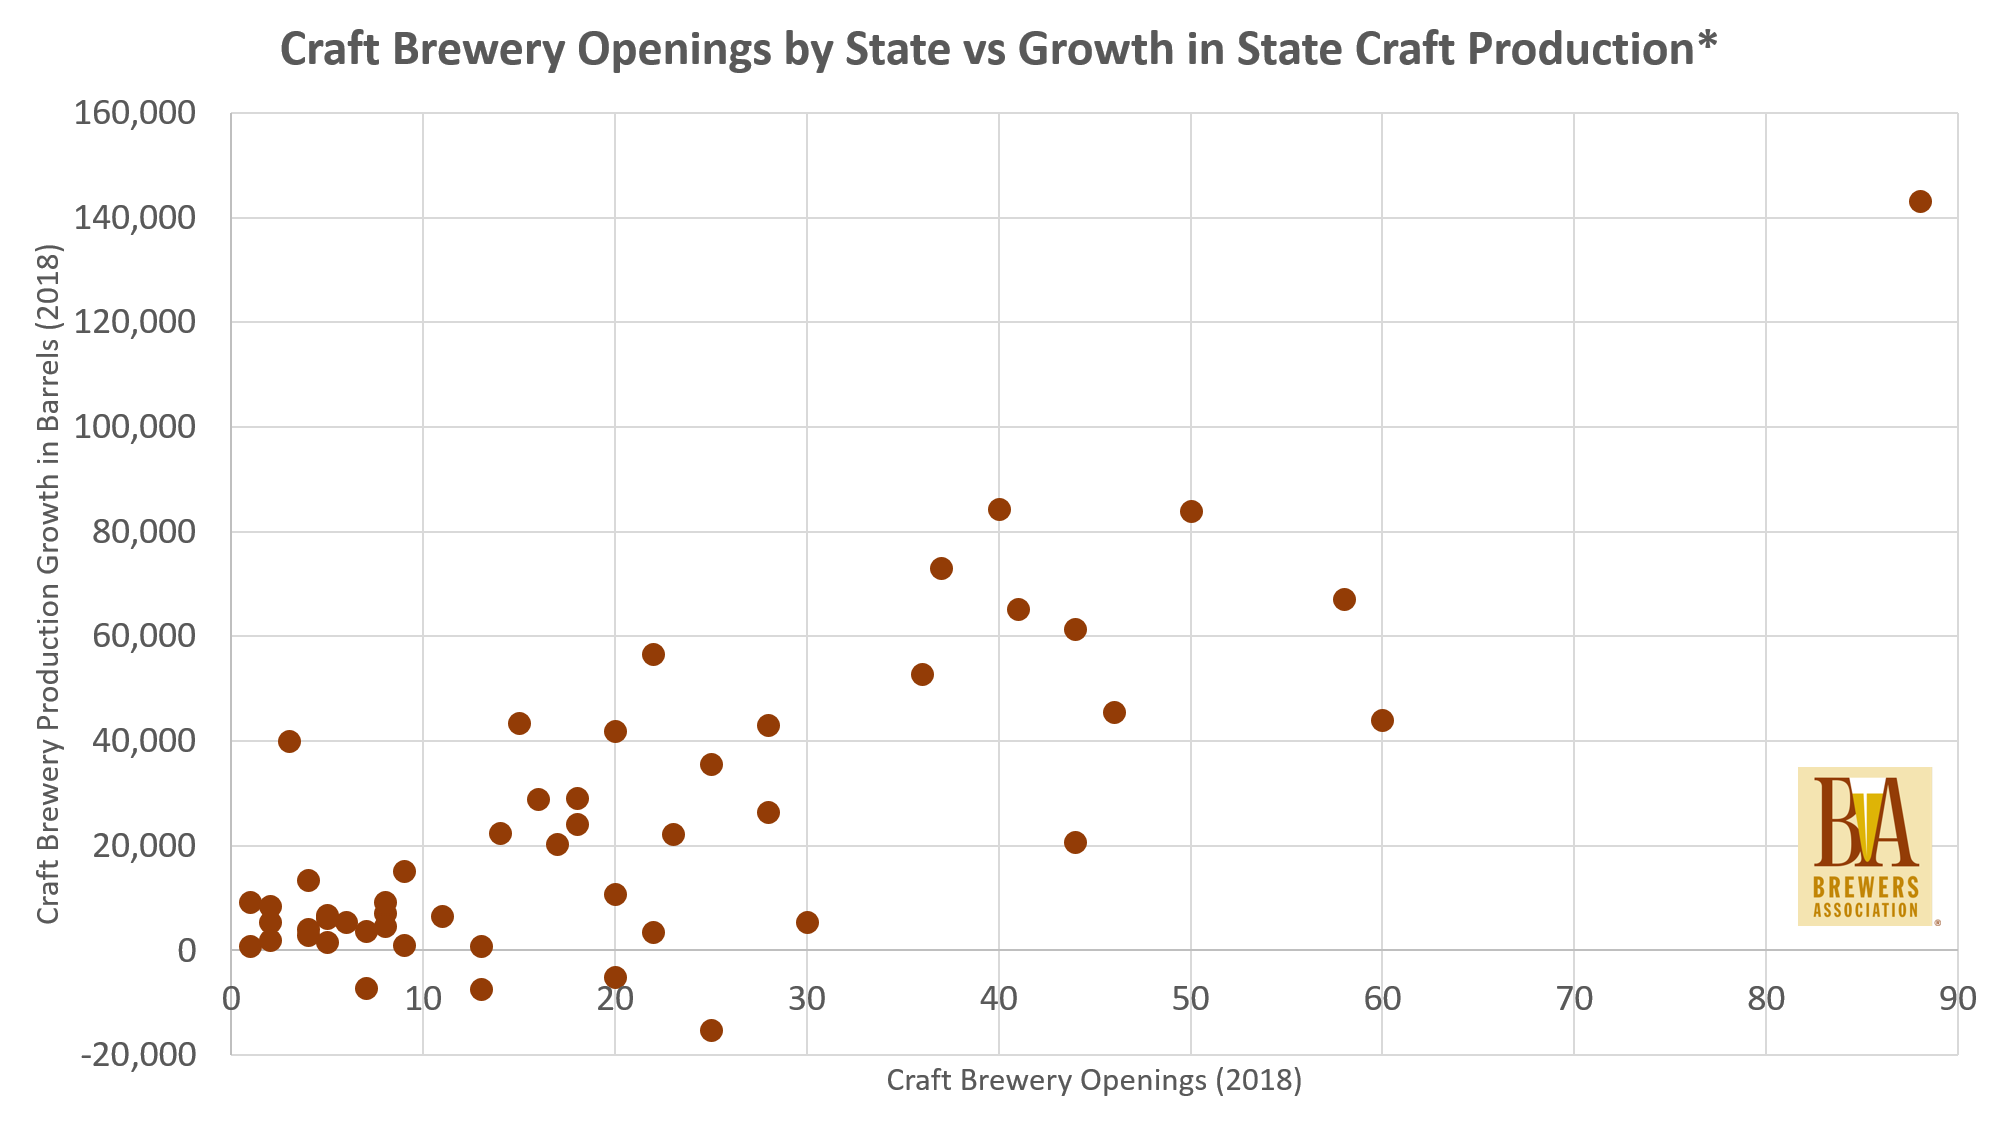
* Top 4 craft brewers removed from state totals. If those brewers are included, the correlation between openings and state growth is still positive and significant, but is about half of the coefficient on the graph seen above.
The chart above underlines what we saw in the overall growth numbers. Craft growth is coming in states that are seeing a lot of breweries open. I’d wager that if we broke this down by at-the-brewery sales and distributed growth, those states would also be seeing a big chunk of that growth from direct at-the-brewery sales. When the TTB publishes their state-by-state premise use numbers, we’ll be able to analyze this more in depth.
One thing these numbers don’t show is how much of that growth is incremental versus simply pulling from the existing market. I think that’s the big question for the next few years, as we will undoubtedly see hundreds if not thousands of new breweries open. How much can those breweries expand the market in their states by opening in a new geography, offering styles or experiences not available in their market, and generally build the category by bringing in new craft lovers rather than simply pulling from the existing set of customers. The states where entrants do the most market building will likely see regionals who are also more healthy and generally continue to have room for growth, whereas I’d expect closings to rise more in states where breweries are simply slicing the pie into smaller pieces. I’m going to muse about how to analyze this more rigorously and will hopefully delve into the topic in the future (suggestions appreciated).


 Resource Hub