
One of the most frequent data requests I’ve been getting recently relates to packaging. As with everything in craft, packaging is an area where change is the constant, so older analyses quickly go out of date.
Packaging is also an area where there are clearly opportunities to differentiate. In our latest Nielsen Craft Insights Panel (CIP), “container type” was the area where the highest percentage (55%) of craft drinkers said there was “not enough” variety, versus 29% for “more than enough” and 16% for “just enough.”
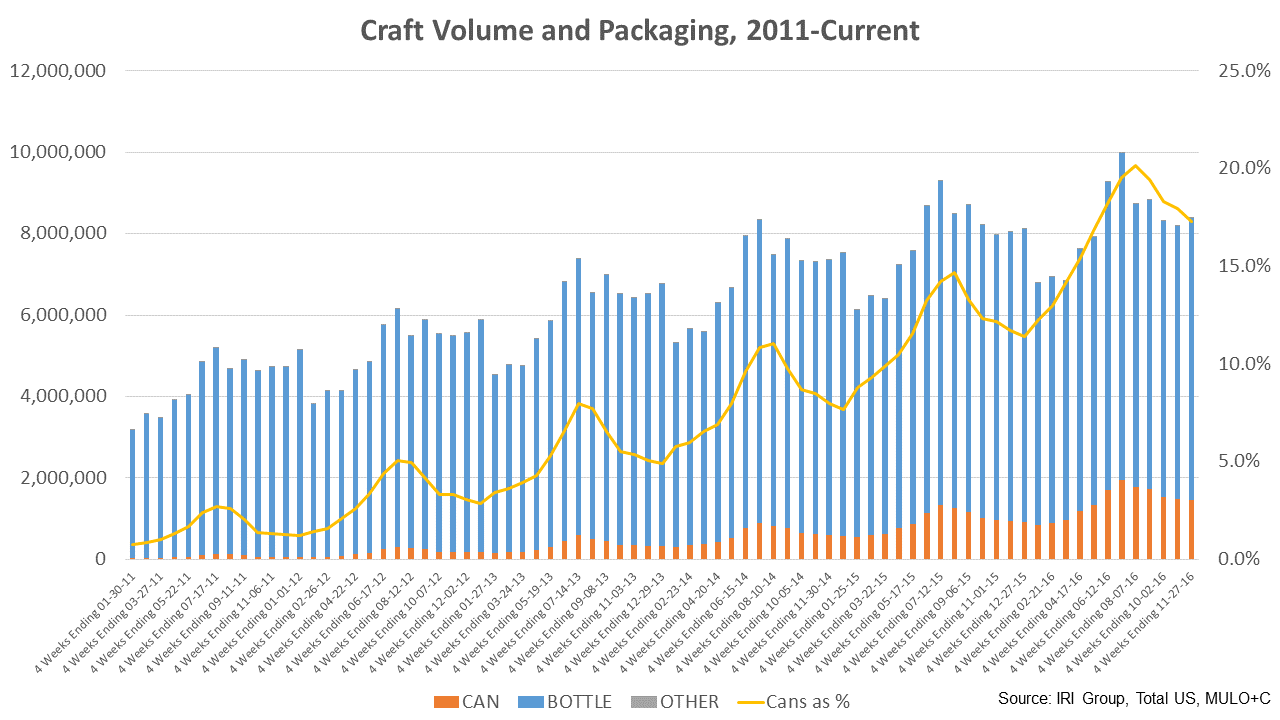
Let’s start with overall trends. First, bottles continue to be the dominant package chosen by craft brewers, but that dominance has continued to ebb. The below graph shows bottles versus cans in absolute volume and as a percentage of craft (scan) volume from 2011 to late in 2016 (Source: IRI Group MULO+C, Total U.S.). As you can see, bottles still clearly outsell cans, but the can percentage has continued to rise. Note that the percentage rise isn’t because of a decline in bottle sales (which have continued to climb), but simply because the increase in can sales has been faster than the increase in bottle sales.
From a consumer perspective, this may be partially due to the closing gap in the perception of bottles and cans. Looking again at the CIP survey, bottles still outperform cans on consumer perceptions of taste, quality, freshness, and value, but those gaps have closed. The full data from that survey is available to members here.
Who is driving these shifts, both size-wise and geographically? Let’s start with size. As you can see from the data below, smaller craft brewers have shifted much more heavily into cans than larger craft brewers. Many of these brewers likely started out by installing a canning line versus a bottling line, whereas larger craft brewers started in an era when that would have been practically unheard of.
| Craft Cans as % of Scan Volume | ||
| Brewery Size (CEs) | 2013 | 2016 |
| <1,000 | 15.8% | 39.5% |
| 1,000 to 9,999 | 20.6% | 40.1% |
| 10,000 to 99,999 | 18.2% | 42.3% |
| 100,000 to 999,999 | 4.3% | 24.7% |
| 1,000,000 to 9,999,999 | 3.9% | 11.1% |
| 10,000,000+ | 5.5% | 10.9% |
| Total | 5.6% | 17.2% |
Source: IRI Group, Total U.S., MULO+C, YTD as of 11/27/16. Data uses IRI Craft Definition.
As you can see, every size category has increased its can share, but the largest craft brewers (who still move most of the volume) have shifted more slowly. Again, this makes sense, as they largely built their brands on bottle packaging. Note that the 17% of scan volume in cans translates to roughly 12% of overall craft volume, as 30% of craft volume is non-packaged (draught).
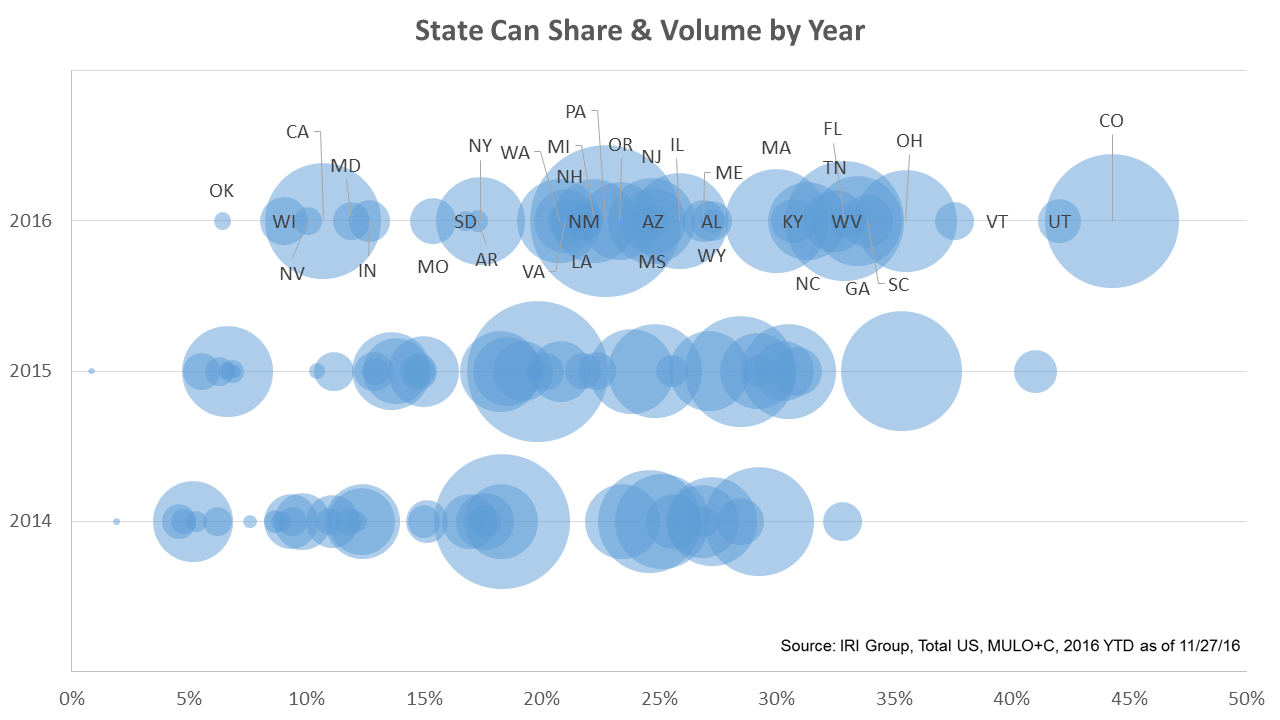
Geographically, there is a pretty wide range state-to-state. The following scan data shows the percentage of sales (not necessarily production) on a state-by-state basis. The percentages range from Colorado, where ~45% of craft sales are in cans, to Oklahoma, where it’s still only 5%. The size of the bubbles represents the size of can sales in scan data, which may not be comparable (so take with a grain of salt). So large states with low percentages (like California) can still have relatively large bubbles. I find it interesting that the distribution has slowly shifted right every year, suggesting that these trends are occurring basically everywhere, albeit at different rates. In the future, it might be interesting to try and find a “tipping point” where a certain percentage of can sales leads to larger increases down the line.
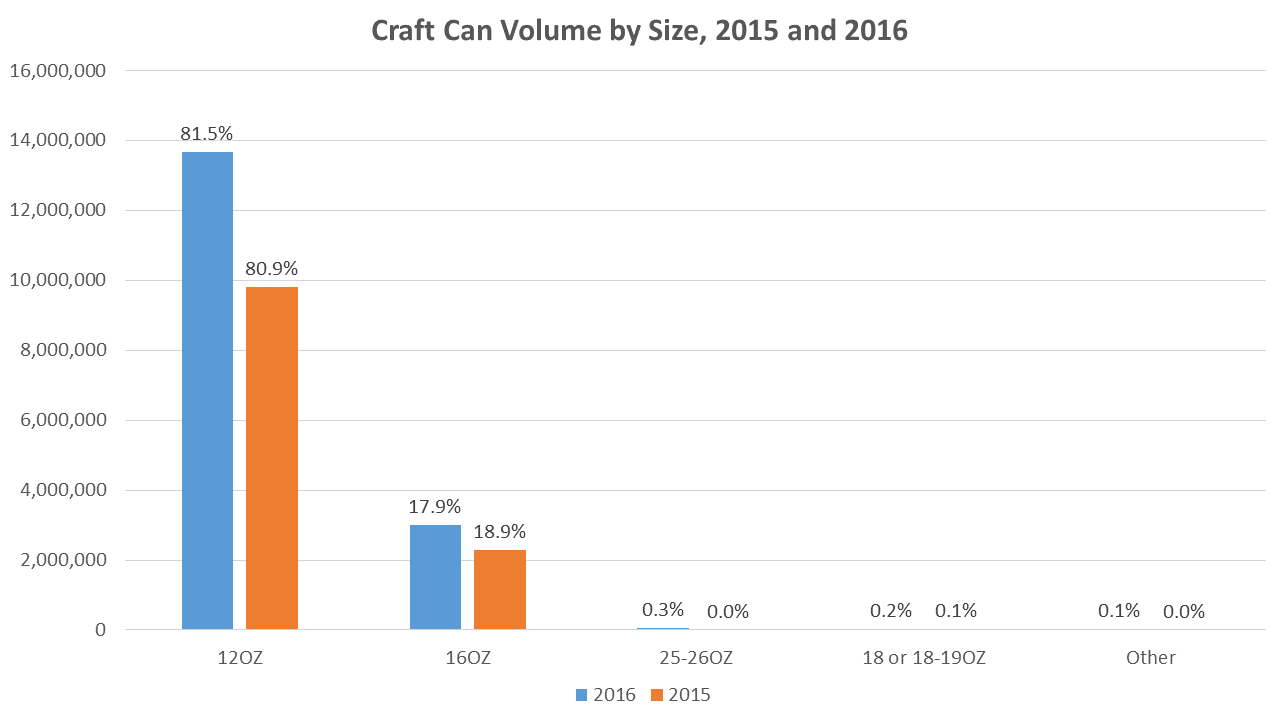
Finally, let’s look at package size. First, I’ll start with cans. For a while, it looked like 16oz cans had gained a lot of momentum. If you’ve followed along in recent IRI power hours, you’ve seen that they’ve typically been growing faster than 12oz. Well, in 2016 that changed, and 12oz took back some can share from 16oz. A lot of this was regional craft brewers moving into the 12oz format, often in larger pack sizes. In the graph below, the height of the bars represents total case equivalents sold (so 16oz still grew) with the percentage of can volume on top. As you can see, formats other than 12oz and 16oz have struggled to gain much traction, even if they are intriguing single-serve formats for channels like convenience.
Let’s end with bottles, which as I stressed at the outset are still the largest package for craft brewers. Below I’ve broken out craft and all beer and shown the percentage of volume that goes into a couple of key packages. As you can see, craft is very concentrated in bottles around 12oz six- and 12-packs (91.9% of packages in those two formats), whereas there is more diversity in all beer (only 59.8% in those two).

Some of this reflects velocity; there aren’t a lot of craft brands that can command more than a few pack sizes. However, it may also show an opportunity. The opening question about “container type” didn’t give the surveyed beer lover much direction, so it’s equally possible that some percentage of those who said they wanted more weren’t just talking about cans vs. bottles, but diversity of pack sizes within a particular container type, such as moving bottles beyond the six- and 12-pack.
To sum up, remember that bottles still dominate craft volume. While both cans and bottles have increased in volume, cans have taken share in the past few years as they have grown faster than bottles. We can attribute this to many factors including a closing perception gap around characteristics like quality (where bottles still lead but cans are catching up), smaller brewers moving more forcefully into cans, and beer lovers who continue to want more diversity in packaging. That final point—desire for more package diversity—suggests opportunities for both package types, particularly as craft brands continue to build in volume and velocity.


 Resource Hub