How did craft brewers do in the first half of 2021? Before I go into some of the data, I’ll point out that the best way to know this definitively is to get the numbers from the brewers themselves, so part of the goal of this post is a thinly veiled promotion of the Brewers Association (BA) midyear survey. Once you finalize your numbers from the first half of 2021, please take a few minutes to fill it out.
The survey is simple. You just need to know your volume or trend versus the same period in 2020 (and 2019 if you were open then). If you have a few extra minutes, there are some additional questions breaking down June number so we can have the latest numbers across different channels. No brewery names will be published, just a category total.
With that business out of the way, we can dive into some of the less perfect measures of brewery performance during 2021. As I wrote a few weeks ago, comparing current trends to last year (or even 2019) is fraught with challenges, so all of these numbers need to be interpreted in a broader context.
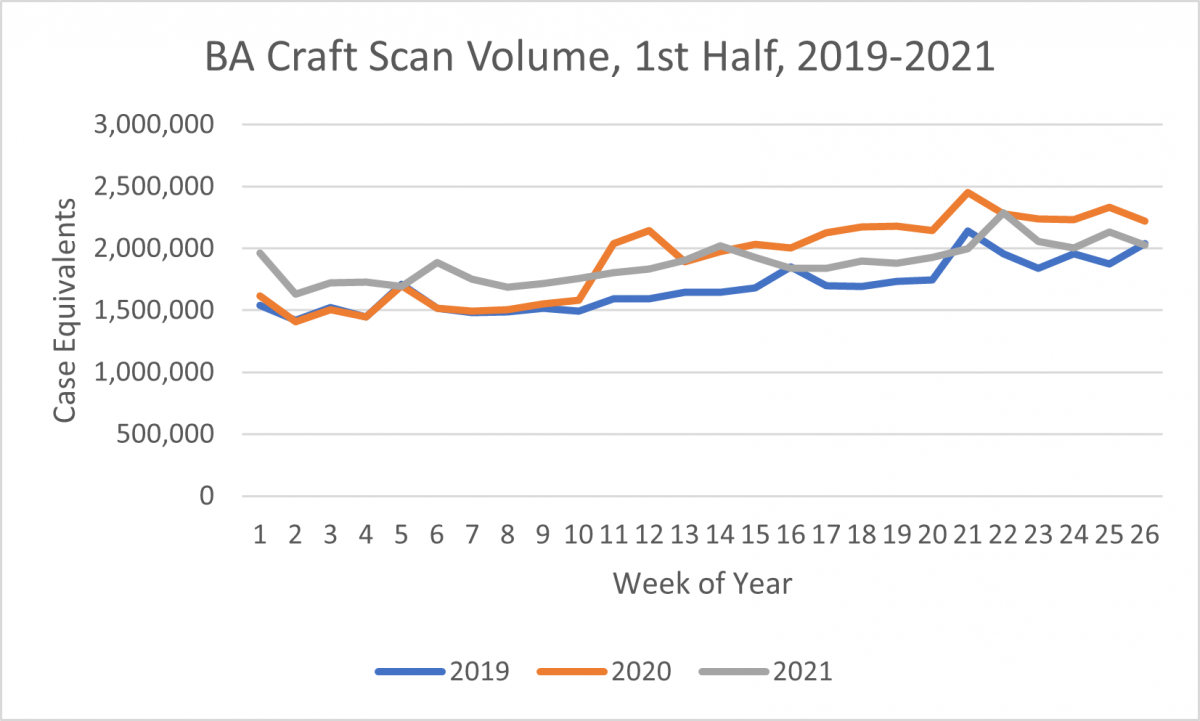
To start, here are volumes of BA-defined craft scan in IRI multi-outlet plus convenience for the first 26 weeks of the year (through the week ending on June 27, 2021).

The narrative I’d assign to this graph is that the first ten weeks were partial pandemic market logic cycling non-pandemic logic. That means a continued strong shift from on-premise to off-premise and elevated sales. From there, you see a weakening of that shift and the cycling versus 2020 suddenly compares to the much larger shift we saw in the first months of the pandemic. And all of this is in the context of a time of the year where, nationally, seasonality is driving growing sales.
Next, here’s growth rates grouped by weeks versus both years:
| Weeks | Vs 2019 | Vs 2020 |
|---|---|---|
| 1 to 10 | 15.9% | 14.4% |
| 11 to 20 | 11.8% | -8.9% |
| 21 to 26 | 6.0% | -9.0% |
Breaking it out this way, you can see that weeks one to ten were pretty similar across both years (there wasn’t much growth from 2019 to 2020 in weeks one through ten), and then you get weakening growth versus 2019 and a huge shift compared to the early pandemic weeks of 2020.
As I wrote previously, for many small brewers, signs from weakening scan may suggest that the off-premise boom may be going away, and in turn pointing to strengthening draught numbers. Right now, I’d say there is light evidence of that. To demonstrate, here’s the draught beer trend versus 2019 from BeerBoard.

That’s improvement, but certainly not enough to offset the scan weakening. Now that’s all beer, not just craft beer, so craft might be doing better within the overall draught trend (the BeerBoard craft share data does suggest that it is, but not enough to make up this gap).
On a more positive note, Alcohol and Tobacco Tax and Trade Bureau (TTB) keg production data through April has shown more improvement, though production may be anticipatory as distributors and retailers rebuild their stock. If craft draught is following closer to this line, it would lend support to the “weakening scan is a good thing” theory.
| Month | 2021 (Barrels) | 2019 (Barrels) | 21 vs 19 |
|---|---|---|---|
| Jan | 465,512 | 1,196,450 | -61.1% |
| Feb | 649,964 | 1,064,546 | -38.9% |
| Mar | 1,008,872 | 1,387,609 | -27.3% |
| Apr | 1,090,825 | 1,284,021 | -15.0% |
The final piece is at-the-brewery sales, which we don’t really have great real-time numbers on. For the first quarter, Arryved point of sale data suggested sales were up 5% versus 2020, but down 20% versus 2019. However, TTB first quarter data for this (which also includes quarterly filers, so is an imperfect measure) shows the flip, indicating a slight decrease versus 2020 but a slight increase versus 2019 (I’m using the TTB’s originally released number to account for revisions). Google search data suggests that sales have resumed the growth we were seeing prior to the pandemic and is up versus both 2019 and 2020, with similar trends versus 2019 in both Q1 and Q2. Based on all three indicators, if I were forced to guess, I’d wager that at-the-brewery sales in the first half of 2021 were at least at 2019 levels, if not a bit stronger, meaning much stronger than 2020, particularly in Q2.
For now, I’ll leave it there. We’ll have a much better sense in a month or two as we compile the data from our midyear survey and get more state and TTB data that includes early summer. Want to help? Take the midyear survey now.
While You’re Here
Speaking of surveys, we’ve also just launched the latest iteration of our salary and benefits benchmarking survey. If you do HR, payroll, benefits, etc. for your brewery, or want to forward it to the person who does, please do so now.
Finally, no matter what you do in a brewery, we’re also working on a survey of demographic benchmarking of brewery workers. Fill it out if you’re an employee, and send it to your co-workers to fill it out as well. It’s anonymous and will provide greater data on who works in the beer industry by place and position.


 Resource Hub