


Here in 2026, GLP-1s often appear prominently on the list of beer’s headwinds. It’s easy to see why: beer consumption is already falling, and more people each year are taking drugs that curb the urge to drink. But how much do the impacts of the drugs actually show up in beer’s performance?
But first, a definition. Glucagon-like peptide-1 (GLP-1) is a hormone the body releases after eating that helps regulate blood sugar and signals fullness. Prescription drugs such as semaglutide mimic its effects, lasting longer than the natural hormone, suppressing appetite and supporting weight loss. Though technically different, I’ll use the phrase “GLP-1s” as shorthand for this broader medication category throughout this post as it’s common parlance.
The reach of GLP-1s is growing. Gallup found that 11% of U.S. adults currently used GLP-1 medications for weight loss in 2026, while 15% had used them at some point (past or present). A separate survey by the Health Management Academy estimated that roughly 48 million adults are either considering or are already using the drugs in 2026.
Speculation for the impact on drinking is based on early studies. In a nine-week study involving 48 adults with alcohol use disorder, semaglutide reduced drinks per drinking day, weekly cravings, and heavy drinking relative to placebo. It did not significantly change average drinks per calendar day or the number of drinking days. But, results from a study of 48 individuals can only be extrapolated so far, and so I wanted to explore what we’re seeing directly in the beer data.
State-By-State Analysis
To look for a market-level pattern, I compared 2024 state GLP-1 figures with beer performance. All else equal, I wanted to test the hypothesis that if GLP-1s have a sizable impact on beer sales, states with greater GLP-1 exposure might produce larger beer declines than states with lower usage.
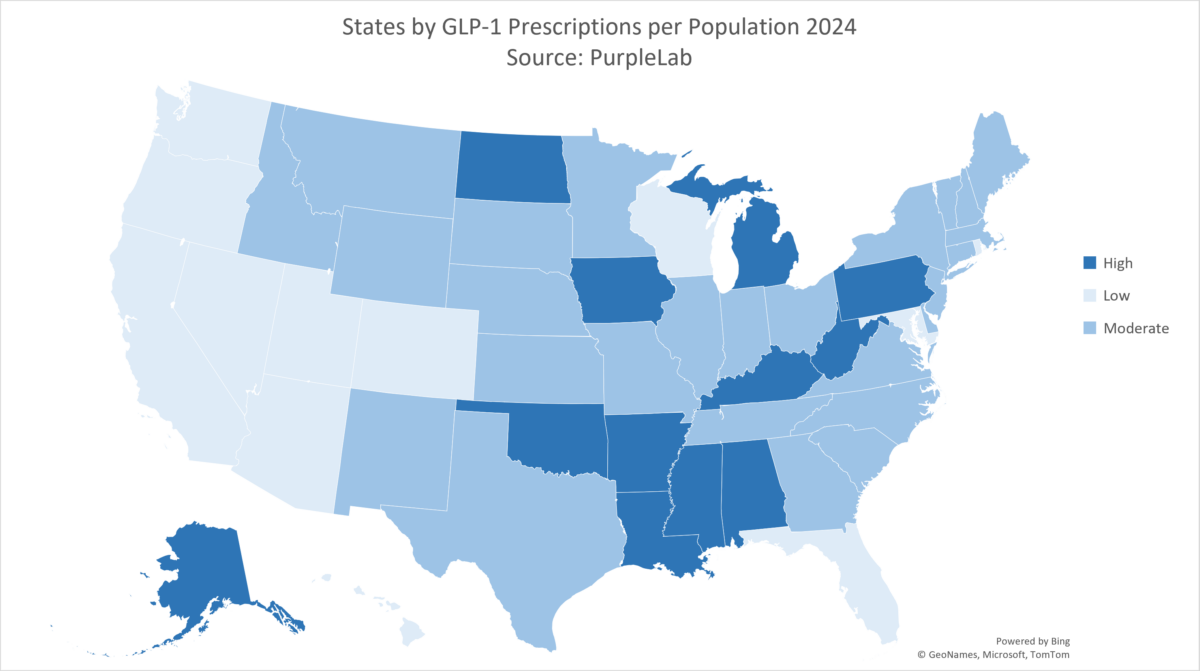
One measurement issue matters here. The state source I used divides prescription counts by population. Its figures range from roughly five prescriptions per 100 residents in Hawaii to 24 in West Virginia. Those are not percentages of unique residents taking the drugs. The underlying insurance claims also exclude some purchases. A person can fill multiple prescriptions, so the distinction affects both the size of the estimate and how we interpret it.
Using the groupings in this analysis, 12 states fall into what I call the Low Usage category (roughly 0–10 prescriptions per 100 residents), 26 in the Moderate Usage category (10–15 per 100 residents), and 12 in the High Usage category (above 15 per 100 residents).
Beer Overall
Beer Institute shipment data doesn’t show the linear relationship across those groups that would be expected from a strong impact. From 2023 to 2024, Moderate Usage states had the largest median decline in beer sales at 2.7%, compared with 1.4% for High Usage and 1.5% for Low Usage. In other words, the Moderate Usage states declined by more than a percentage point beyond that of either extreme.
The longer view was similar. From 2023 to 2025, median shipments fell 7.4% in Moderate Usage, versus 6.3% in High Usage and 6.4% in Low Usage states.
Shipments measure beer moving into a market, which can also reflect inventory changes. They are useful for this comparison, but they don’t track what individual GLP-1 users purchase or drink. Nor does grouping states account for their differing beer trends before treatment became widespread.
Accounting for population didn’t change the results. Median shipments per capita 2023-2024 declined 4.2% in Moderate Usage, compared with 3.1% in Low Usage and 2.7% in High Usage.
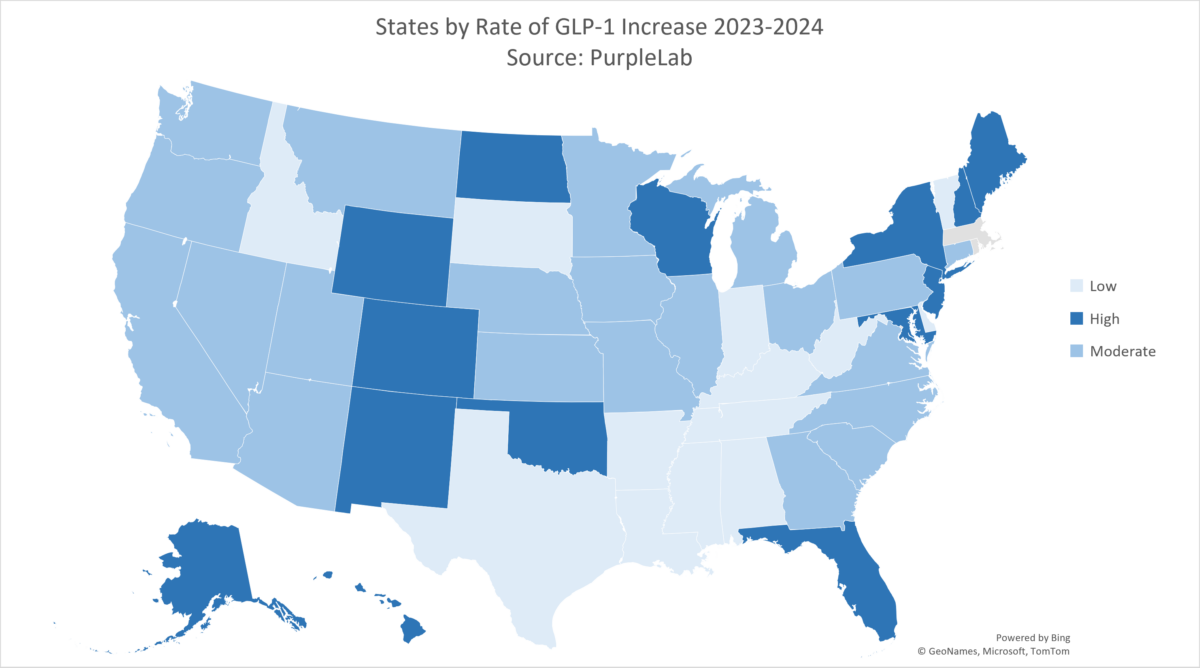
The one cut of the data that did support the hypothesis somewhat was in looking at beer sales broken down by states with the largest year-over-year increase in GLP-1 prescription rates. Among the High Increase states, beer shipments declined 4.5% whereas the Moderate Increase group dropped 3.5% and the Low Increase group was down 3.8%.
The Craft Comparison
Next, I wanted to look at craft specifically. While not as useful of a metric as shipments (since volume produced sometimes goes out of state for sales), we have craft production by state to compare. For craft production, the median state changes from 2023 to 2024 were nearly identical across groups, with declines of 4.3% in High Usage, 4.1% in Moderate Usage, and 4.2% in Low Usage.
Combining each group’s production volumes produced one notable exception. Total craft volume fell 11% in the high group, compared with 1% in the medium group and 4% in the low group. The national decline was 3.9%. Total Beer Institute shipments, by comparison, declined at similar rates across all three groups.
The distinction matters. Medians describe the middle state while combined volumes give larger producers more influence. But, as mentioned above, craft beer also crosses state lines, so production in a state doesn’t necessarily reflect consumption by its residents.
What Can We Take Away?
These comparisons don’t reveal a consistent relationship between greater GLP-1 exposure and steeper beer declines. They also don’t establish the drugs’ impact to be minimal or absent. State differences in demographics, drinking habits, and economic conditions could obscure an effect.
That said, it’s worth exploring why the middle might perform worse. While we don’t know the makeup of GLP-1 users in any given state, higher-exposure states might include more patients whose health conditions had already limited their drinking, while medium-exposure states might include more people with good insurance seeking aesthetic weight loss who previously drank more. This is simply a hypothesis that would need to be validated (or refuted) by additional analysis should that data become available.
The differences could also reflect unrelated trends or chance. At this time and with this information, I wouldn’t be convinced to assign the moderate group’s larger decline simply to GLP-1s.
I’ll revisit this as better usage data become available. Adoption is still rising, and any broader effect may take time to emerge. Affordability remains a barrier in GLP-1 access, and lower costs could expand the market further. For now, GLP-1s remain a plausible contributor to beer’s challenges, but they do not appear to be a prescription boogeyman that the beer industry can pin much of its struggles on.
Yet, even if there are not clear ties to volume change, GLP-1s could be shifting other aspects of beer under the surface. It could be changing the styles that people are drinking (e.g. to lighter, lower carbonation styles) or could change when and where the consumption is happening.
If you have noticed any shifts at your brewpub or taproom that you think could be linked to GLP-1s, I’d be interested in hearing from you. It seems clear that there’s still much to learn.


 Resource Hub