

Last week, the Brewers Association launched the second of our surveys designed to gauge the impact the current COVID-19 pandemic and subsequent social distance public health measures are having on small brewers. The results of the first survey can be found here.
For information on survey and analysis methodology, see the note at the bottom of this post.
The results show a sharp drop in craft category sales, massive furloughs or layoffs, and the high likelihood of large numbers of brewery closings without a swift end to social distance measures—which looks increasingly unlikely—or rapid government support for small brewers and hospitality more broadly.
A majority of breweries do not think their business can last three months given current conditions, suggesting thousands of closings.
The final section of this post will discuss the policies that breweries have already found helpful, and what policymakers should consider as immediate steps to take in order to stop or reserve the economic damage that is occurring.
Sales Trends
Respondents were asked to provide their decrease in sales by channel. For distributed channels, this was broken into draught and packaged. Those results have been weighted by brewery size to give a sense of total category impact.
First, let’s look at onsite sales. The median respondent has seen their sales drop 75%, with an average drop of 65%, and an adjusted weighted average drop also of 65% (see note at end on adjustments). Below is a distribution of sales change. As you can see, most breweries are experiencing drops in excess of 70%, with a limited number of breweries seeing smaller drops or positive growth, and an even smaller number seeing large gains.
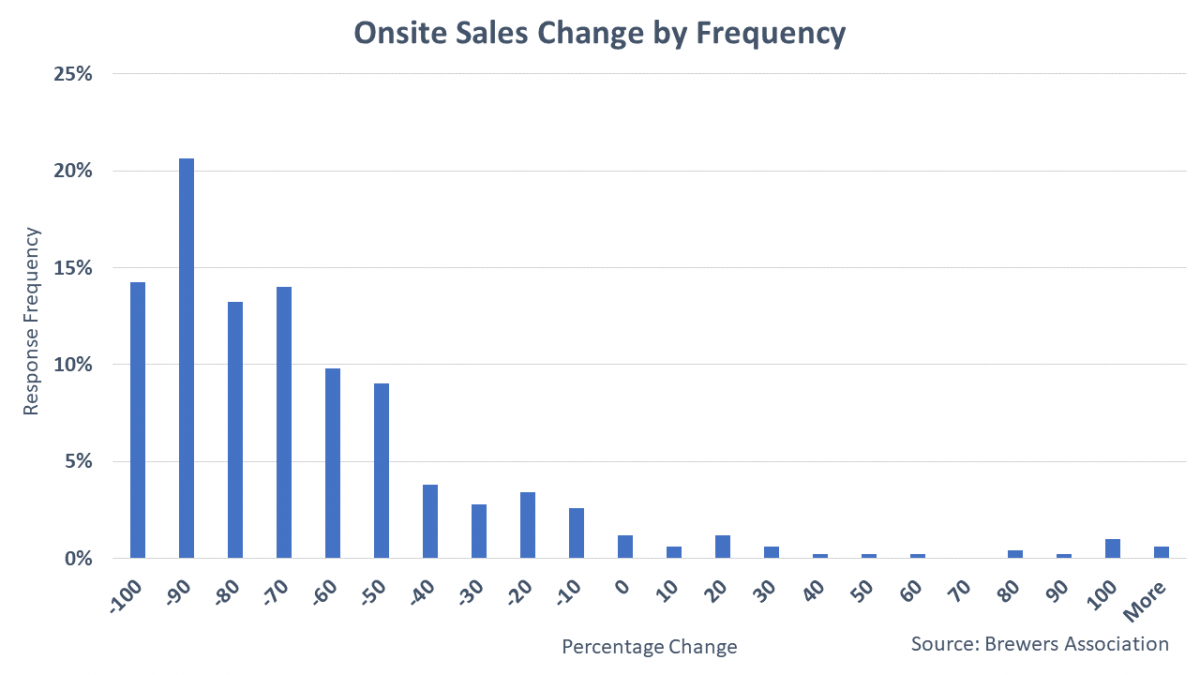
Although it’s possible some of the 100% growth numbers are mis-reported, most of those breweries reported sharply negative draught and packaged sales, and a review of their strategy suggests that some breweries have been able to ramp up direct-to-consumer (DTC), drive-up, and delivery sales to a point those exceed their previous onsite sales. This should not be viewed as feasible for all brewers, nor should it be seen as a total replacement for draught sales. One hundred percent growth in taproom sales via drive-up only helps so much when your taproom was 5% of sales and distributed draught 75%.
Distributed Draught
The sharpest declines are in distributed draught. With on-premise largely closed for business, there are few to no outlets for distributed draught in most states. These results are the most consistent, regardless of the statistic used: median drop in sales is 100%, average drop is 91%, and weighted average (accounting for both sample weights and volume) show a drop of 95%.
Off-Premise
By this point, you may have read in the trade press how in scan data, beer is seeing huge gains in recent weeks as people stocked up and as some of the volume lost in the on-premise shifted into off-premise. However, scan data isn’t always representative of the experience of many small brewers, even in the off-premise. So what did our data show?
The weighted average (probably the most appropriate to use in this case), shows packaged distributed volume up 7.9%. That’s about half the growth seen the last four weeks in scan. Brewers Association craft in IRI Group data (total U.S., MULO+C) is up 18.3% by volume in the four weeks ending March 29, 2020. The disparity likely reflects drops in smaller off-premise retailers who aren’t measured by scan, generally those where the smallest brewers begin in off-premise. Indeed, the median growth from the respondents (there were 346 for this question, which makes sense, since many brewers don’t package) was 0%, and an unweighted average was -11.7%. So, while there likely is a bump for the overall category in off-premise, this isn’t helping the smallest micros, taprooms, and brewpubs that much, since much of the bump is concentrated in bigger retailers and larger package sizes.
Update: As a sharp member pointed out to me, our question was about “distributed package”, which would also cover packaged beer sold to the on-premise, which is another reason why our survey number might be significantly lower than scan data, which only covers off-premise package.
In Total
Using our three weighted averages (-65%, -95%, and +8%) and a rough 13% onsite, 27% distributed draught, and 60% packaged distribution breakdown, that gives a category that is in total down 29%, with many brewers, particularly those not in packaging, down much further. In a best-case scenario using the scan number for off-premise, the number “improves” to -23%.
Existential Threat
For many small brewers, the current situation is not sustainable. Being a responsible business owner means scenario planning, but few if any build plans for a near complete drop in revenue with no insurance protection and continued bills to pay.
Consequently, in response to the question, “Given current costs, revenues, and the current level of state and federal aid, how long do you project you can sustain your current business if social distance measures stay where they are now?” many brewers indicate that their business has a matter of weeks, and a majority say that they can only last a few months based on current trends.
| Percent Responding | |
|---|---|
| None, I am planning to close | 2.3% |
| 1 week - 4 weeks | 11.8% |
| 1 month - 3 months | 45.8% |
| 3 months - 6 months | 24.8% |
| 6 months - A year | 8.9% |
| Longer than one year | 6.4% |
As of writing, there are about 8,150 active breweries in the country. If 2.3% of those breweries close, that would mean about 190 closures, 11.8% about 930 closures, and 45.8% about 3,735. Based on recent trends, it was likely that 4-5% of the breweries in the country would have closed in 2020 prior to this shock, so while some percentage of these closures and potential closures reflect business that were already struggling, most are brought on solely by this event.
Update: A reminder that most small breweries are really small. Approximately 75% of the breweries in the country make 1,000 barrels or less a year and the median craft brewer makes about 400 barrels. Consequently, the breweries indicating they may need to close are by and large very small. The 14.1% of breweries who say they may a month or less represent 2.2% of the volume in this sample. More service-oriented brewers (brewpubs and taprooms) have higher percentages for the responses up to 3 months, whereas packaging brewers (micro and regional) have a majority of their responses in the 3 month+ categories and 10% of that group is in the “longer than one year category.”
Staffing
Faced with little to no revenue, brewers are furloughing and/or laying off staff. The brewers who responded to our survey stated they employed a collective 15,190 workers prior to COVID-19, with 8,433 full-time and 6,757 part-time workers. The brewers surveyed have already laid off a majority of those workers. The table below shows the percentage of workers laid off by various metrics. Total is simply the percentage laid off. Full Time (FT)/Part Time (PT) are the percentage laid off in each category. Full time equivalent (FTE) uses a measure of 1 for FT workers and .5 for PT workers.
| Brewery staff laid off and/or furloughed | |
|---|---|
| Total | 66.1% |
| FT | 53.2% |
| PT | 82.2% |
| FTE | 61.5% |
Recent government support has helped a small amount, but as others have pointed out, the PPP forgivable loans are not ideally designed for small hospitality businesses with little to no revenue coming in.
Our next survey question was, “Given the recent stimulus package, do you anticipate re-hiring employees this month if you are not able to fully re-open?” Breweries’ responses are below:
| Percent Responding | |
|---|---|
| No | 33.5% |
| No, but I did not lay anyone off yet | 19.0% |
| Yes, some | 35.1% |
| Yes, all | 12.4% |
About a third of breweries won’t re-hire workers until they can re-open and 35.1% will only partially re-hire. Only 12.4% plan to fully re-hire workers.
What Has Helped?
We surveyed brewers about which provisions in recent packages they have used or plan to use. Here are the top ranked answers, with the percentage of breweries saying they have been helpful to their businesses.
- Forgivable loans [SBA 7(a)] – 83.6%
- Emergency grants up to $10,000 – 55.9%
- Disaster loans [SBA EIDL] – 50.4%
- Increased unemployment provisions – 47.1%
- Delayed payroll tax payments – 45.8%
- Increased interest expense deduction – 26.3%
- Facility write off provisions – 22.3%
- Excise tax waiver for alcohol used to make hand sanitizer – 11.3%
Taken together with the previous questions, these results suggest that the CARES Act had value for small brewers, but simply didn’t go far enough to counterbalance the economic challenges they face while being closed.
Finally, we asked brewers about what other provisions, either included in a phase 4 bill, or passed sooner as state or federal standalone policies, would be most helpful. Note, to focus our advocacy, we chose to limit these options to policies that had some aspect of specific applicability to the beer industry (so the BA is uniquely positioned to ask for) and/or hadn’t already been surveyed about. The number one answer shouldn’t be a surprise. This is the reason that we didn’t ask about policies such as a mortgage/rent payment freeze, which have broader applicability and the BA would act on as part of a larger small business coalition.
- More direct grants for breweries and other hospitality businesses – 82.8%
- Permanent excise tax recalibration (make current rates permanent) – 71.4%
- Spoiled beer tax credit – 69.0%
- Excise tax payment delays – 50.8%
- Additional market access in my state (greater to-go, delivery, or DTC rights) – 50.4%
Brewers need more direct relief, and failing that, they need help in the form of excise tax certainty and credits to offset the hundreds of millions of dollars that was already in the trade or sitting in tanks when the on-premise ground to a virtual standstill.
There is no easy way to summarize the results above other than to say they show the extreme urgency for further action to forestall the closures of thousands of small businesses and the loss of jobs of tens of thousands of more workers.
Thanks to those brewers who took a few minutes to fill out our survey – we’ll do our best to transmit your story to policymakers as quickly and loudly as possible.
Methodology:
The analysis above covers 525 responses (through the afternoon of Thursday, April 9) , across 49 states plus the District of Columbia. The respondents appear to be broadly representative of the small brewing industry, with the exception that brewpubs are slightly underrepresented and small production microbreweries over-represented. Brewpubs are around 35% of total craft breweries and 6% of total craft volume, but are only 23% of the breweries and 4% of the volume in this sample. Microbreweries (small production breweries) are 24% of all breweries and around 18% of craft volume, but represent 29% of the breweries in this sample and 24% of the volume. The references to weighted figures make adjustments for these representation issues (and the much smaller discrepancies in regionals/taprooms).

 Resource Hub